Pivot tables
ProTip: Refer to Pandas User Guide
While pivot() provides general purpose pivoting with various data types (strings, numerics, etc.), pandas also provides pivot_table() for pivoting with aggregation of numeric data.
The function pivot_table() can be used to create spreadsheet-style pivot tables. See the cookbook for some advanced strategies.
It takes a number of arguments:
- data: a DataFrame object.
- values: a column or a list of columns to aggregate.
- index: a column, Grouper, array which has the same length as data, or list of them. Keys to group by on the pivot table index. If an array is passed, it is being used as the same manner as column values.
- columns: a column, Grouper, array which has the same length as data, or list of them. Keys to group by on the pivot table column. If an array is passed, it is being used as the same manner as column values.
- aggfunc: function to use for aggregation, defaulting to numpy.mean.
Example
1
2
3
4
5
6
| import pandas as pd
import numpy as np
import matplotlib.pyplot as plt
import seaborn as sns
%matplotlib inline
|
1
2
3
| data_url = 'https://s3.amazonaws.com/tripdata/201907-citibike-tripdata.csv.zip'
data = pd.read_csv(data_url)
|
|
tripduration |
starttime |
stoptime |
start station id |
start station name |
start station latitude |
start station longitude |
end station id |
end station name |
end station latitude |
end station longitude |
bikeid |
usertype |
birth year |
gender |
| 0 |
897 |
2019-07-01 00:00:00.1320 |
2019-07-01 00:14:58.0040 |
493.0 |
W 45 St & 6 Ave |
40.756800 |
-73.982912 |
454.0 |
E 51 St & 1 Ave |
40.754557 |
-73.965930 |
18340 |
Subscriber |
1966 |
1 |
| 1 |
267 |
2019-07-01 00:00:05.1780 |
2019-07-01 00:04:32.4500 |
3143.0 |
5 Ave & E 78 St |
40.776321 |
-73.964274 |
3226.0 |
W 82 St & Central Park West |
40.782750 |
-73.971370 |
21458 |
Customer |
1996 |
1 |
| 2 |
2201 |
2019-07-01 00:00:05.2130 |
2019-07-01 00:36:46.7490 |
317.0 |
E 6 St & Avenue B |
40.724537 |
-73.981854 |
3469.0 |
India St & West St |
40.731814 |
-73.959950 |
39874 |
Subscriber |
1986 |
1 |
| 3 |
1660 |
2019-07-01 00:00:08.6010 |
2019-07-01 00:27:48.8050 |
249.0 |
Harrison St & Hudson St |
40.718710 |
-74.009001 |
369.0 |
Washington Pl & 6 Ave |
40.732241 |
-74.000264 |
38865 |
Subscriber |
1988 |
1 |
| 4 |
109 |
2019-07-01 00:00:12.1580 |
2019-07-01 00:02:01.5670 |
3552.0 |
W 113 St & Broadway |
40.805973 |
-73.964928 |
3538.0 |
W 110 St & Amsterdam Ave |
40.802692 |
-73.962950 |
30256 |
Subscriber |
1997 |
1 |
1
2
| data['starttime'] = pd.to_datetime(data['starttime'])
data.set_index('starttime', inplace=True)
|
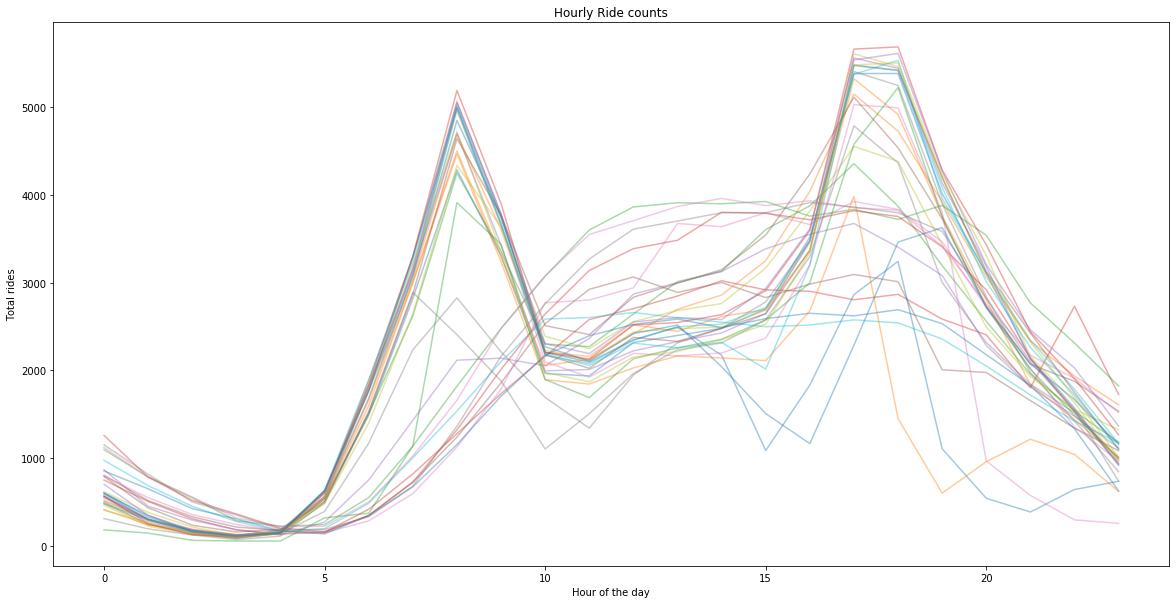
Create a pivoted table with count of rides for every day
1
| pivoted = data.pivot_table(values='bikeid', index=data.index.hour, columns=data.index.date, aggfunc=lambda x: len(x.unique()))
|
|
2019-07-01 |
2019-07-02 |
2019-07-03 |
2019-07-04 |
2019-07-05 |
| starttime |
|
|
|
|
|
| 0 |
605 |
500 |
513 |
748 |
865 |
| 1 |
324 |
241 |
301 |
504 |
450 |
| 2 |
176 |
161 |
162 |
307 |
291 |
| 3 |
105 |
104 |
98 |
180 |
181 |
| 4 |
156 |
154 |
141 |
132 |
122 |
1
2
3
| ax = pivoted.plot(legend=False, alpha=0.4, figsize=(20, 10), title='Hourly Ride counts');
ax.set_xlabel("Hour of the day")
ax.set_ylabel("Total rides");
|