I am a scientist by day (and often by night). I am driven to make sense out of complex, multivariate data. I also love wraps. So this is the start to a mashup between two of my favorite subjects. My goal here is to quantify the wrapping qualities of individual wraps and use data analysis and visualization techniques to help us understand which wraps are similar to each other, how wrapping qualities are related to each other (and the wrap reviewer), and which combination of wrapping qualities are best suited to each individual wrapper. This is the first of many posts discussing the nitty gritty of wrapping qualities, quantification, and visualization. I have recruited other experienced wrappers to help generate some wrapping quality data for me, but in this post I describe my own wrap scoring.
I started by making a list of all pavotextiles wraps that I have tried. In a spreadsheet (matrix), I scored ten wrapping qualities on a scale of 1 (low) to 10 (high). These wrapping qualities were: cush, thickness, grip, bounce, stretch, soapiness, density, recovery, moldability, and sponginess. I was surprised how difficult this was. I fiddle with the scores each time I open this spreadsheet, but for the good of public wrap geekery, I am just going to post what I have here at this time. I expect these data to be different for each wrapper.
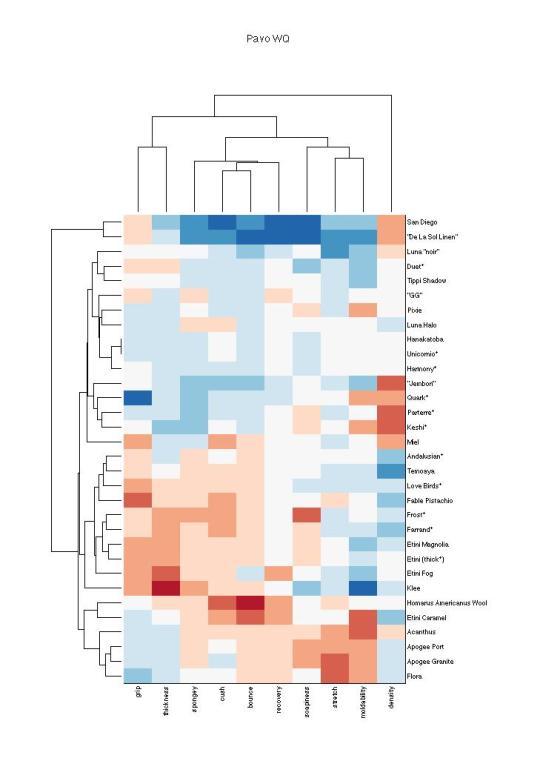
There are several different ways of visualizing these data. The most intuitive to me is an ordered heatmap called a clustergram. A heatmap is a matrix where the color of each grid/square maps to the value of the wrap and wrapping qualities at that square in the matrix. In my heatmap, red is high and blue is low. I used an algorithm that clusters like wraps and like wrapping qualities and displays this information with a dendrogram. A dendrogram looks a bit like an upside down tree where the “leaves” coming off of a common branch are most like each other. Please click on the figure below so you can see it better.
Each row of this heatmap shows the wrapping qualities of one wrap. So a quick pass down the heatmap shows you which wraps are similar to each other and how. I am a little obsessed with looking at this figure. (And apologies that the text is not larger!) You can see that Frost and Farrand cluster, Temoaya and Andalusian cluster, and Unicornio, Hanakatoba, and Harmony cluster. There are many other “like” clusters of wraps. Wrapping qualities are also related to each other. For example, cush and bounce cluster, as do stretch and moldability.
There are other ways to visualize these data, and each wrapper will find a different visualization technique more intuitive. I stare heatmaps often, but I realize that this is not the best format for many people. Another visualization is a glorified scatter plot called a bubble plot. Here, you can map wraps according to two qualities, and color and size each bubble by two other wrapping qualities. Below, I have placed wraps on the plot by their stretch (x-axis) and grip (y-axis), colored the bubbles by wrap thickness, and sized the bubbles by cush. You can scroll over the graph to see which wrap is represented by each bubble. I recommend that you explore this bubble plot by clicking on the “play with this data” link, because it will improve the aspect ratio. (I just noticed that the graphic doesn’t appear from the iPhone tumblr app. You must use a browser.)
I hope to be back soon with data from other wrappers, merged data from many wrappers together, and improved visualization and analysis methods. Please let me know if you have suggestions!